Visualise Localities
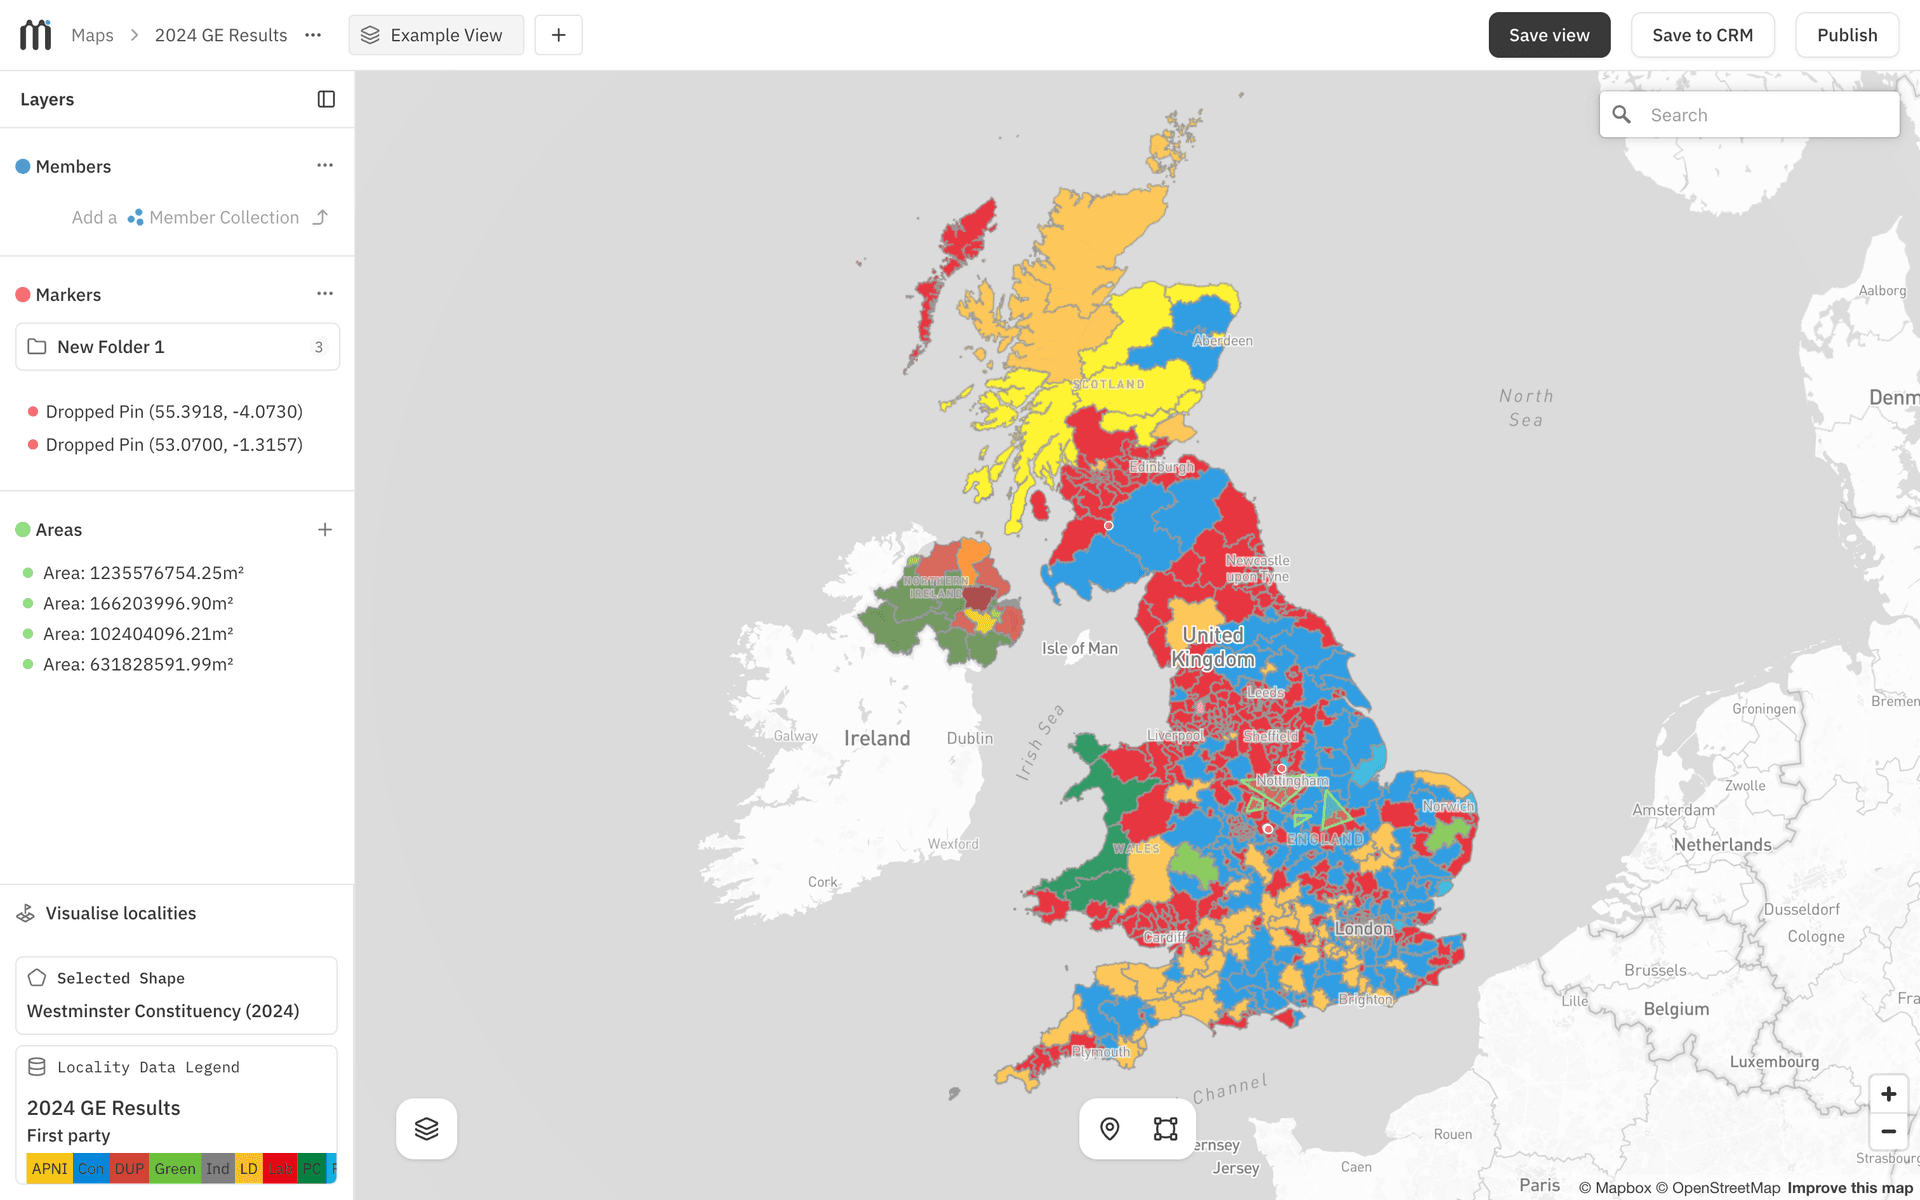
Provide more context to your map by Visualising the Localities.
Either simply show boundaries by selecting the following:
- Census Output Area
- Westminster Constituency
- More coming soon
Fill these boundaries with a colour scheme based on reference data that you have in your data sources, or choose from the mapped data library.
